INTERACTIVE DEMOS
Explore interactive demonstrations of computational methods developed in the Foy Lab.

Gaussian Mixture Models for Setpoint Identification
Identify patient-specific setpoints in blood count data using Gaussian Mixture Models. Automatically fits optimal models to time series data and visualizes the results with dynamic confidence intervals.
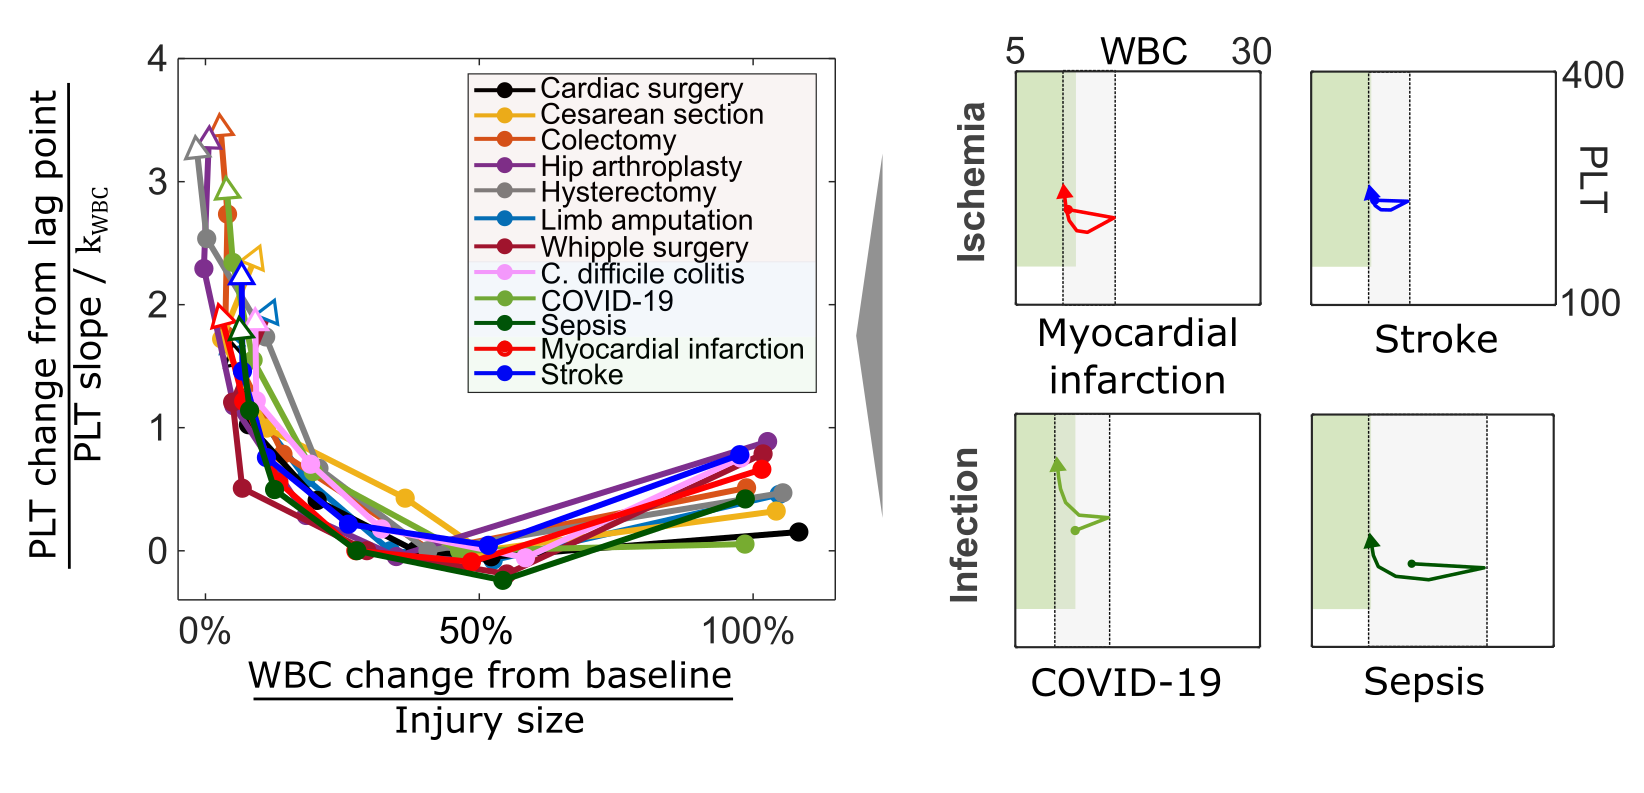
WBC-Platelet Recovery Trajectories
Visualize inflammatory recovery dynamics by plotting WBC and platelet counts in 2D trajectory space. Explore co-regulatory patterns that indicate recovery stage from acute inflammatory events.

RBC Shape Classification
Demonstrate computer vision-based classification of red blood cell morphologies. Analyze sample blood smears to quantify normal cells, sickle cells, spherocytes, and other RBC shapes.